The data collection and analysis for the 2023 Swiss Accessibility Study – Mobile Apps was carried out using the methodology described below.
Test objects
46 apps were subjected to testing on the basis of WCAG 2.1 Compliance Level AA testing criteria. This standard was originally designed for websites. As part of the development of the ‘Access for All’ foundation’s app certification (Link öffnet in einem neuen Tab), the test methods were adapted to the specific characteristics of mobile apps. For instance, some test criteria were interpreted differently and criteria like source code verification were not applied.
Mobile apps that are popular in Switzerland and used to cope with aspects of everyday private or professional life were selected as test subjects. Detailed documentation regarding the selection process can be found in the section ‘How we selected the apps’.
The apps tested were sourced from the official iOS and Android app stores. A number of the apps tested required setting up a user account for full use. A distinction should be made here between simple user accounts, which only require an email and a password, and those which require the identification or verification of the user. For apps that require verified accounts, we clarified in advance whether the testers already had access. If they did not have a personal account, the publishers were asked for trial access. The publishers of ePost App, MySwisscom and Well were kind enough to provide us with the relevant access. In the case of the ePost App and Well apps, the publishers provided us with unpublished versions of the app so that we could safely test the entire app.
The testing took place between June and August 2023.
Test criteria
Criteria-based (quantitative)
The success criteria of WCAG 2.1 at compliance level AA consist of 50 success criteria, 30 of which are assigned to compliance level A and 20 to compliance level AA. Each success criterion may include one or more requirements, with a total of 58 requirements. However, not all requirements are transferable to mobile apps. That’s why we worked with a set of 46 requirements.
The sole focus the entire test setting was accessibility. I.e., our accessibility specialists did not assess the quality of the apps in terms of scope of use, technical features or user experience (usability or user experience). The sole focus of all assessments carried out as part of the accessibility study was always on testing accessibility.
Scenario-based (qualitative)
The tests were carried out across defined scenarios. Depending on the complexity of the app, there are three to six scenarios. A common scenario across all apps was the use of the settings page. Similar apps in certain categories, such as chat or shopping apps, were tested for better comparability with (as far as possible) identical scenarios. The scenarios constitute typical use cases for the respective apps. For example, the test scenarios for the Coop, Lidl and Migros shopping apps included finding a store, browsing the range, studying product details, using and managing shopping lists, and checking shopping lists.
Testing phase procedure
Test environment
We did not use a standardised test environment because we wanted the study to test the reality of using an app as opposed to what happened under ‘laboratory conditions’. However, the fact that all apps were continuously tested on the iOS platform provided a certain consistency in the testing environment. In order to take the situation on Android smartphones into consideration too, five apps were also tested on Android (you can find details regarding the selection in the section ‘How we chose the apps’).
Test procedure
Each app was evaluated by three different accessibility experts: A sighted person tested all the requirements. A blind person tested all requirements that could be verified without sight. A third person was responsible for testing the requirements that required eyesight to verify (for example, assessing contrast requirements, the zoomability of text sizes, or visibility of keyboard focus). So, each requirement was subject to two independent assessments. The scenario-based tests were carried out by all three trial participants.
Criteria-based tests
The criteria-based tests were carried out on the basis of the defined set of 46 requirements. The accessibility experts each gave an independent evaluation of compliance for each of the requirements tested. A scale from 0 (not met) to 10 (met in full) was used. If two evaluations of one requirement differed by more than three points, the two testers in question analysed their assessments in a comparison. If one person made an observation that the other person missed, the other person adjusted their assessment accordingly. If specific requirements to be tested, such as multimedia content or forms, were not present in the defined scenarios, parts of the app that contained such elements were investigated.
Scenario-based tests
The scenario-based tests assessed the feasibility of typical usage scenarios of an app or app groups, such as communication apps. The focus here was not on the subjective user experience of the testers, but on an evaluation from the perspective of accessible use. Accordingly, in the scenario-based tests, assistive technologies like screen readers and alternative input methods such as keyboards were used by all test users and various configurations such as text enlargement, landscape/portrait format and colour reversal were used. The results were recorded and scored for each scenario. A simplified scale with the following three scores was used for this:
- Score 6: The scenario is completely feasible in an accessible manner.
- Score 4: Barriers hinder use. The scenario is feasible.
- Score 1: Barriers make this action from being carried out. This scenario is not feasible.
Requirements that could not be assessed
Generally speaking, only the requirements that could be met in the corresponding app were assessed. For example, not every app features video content, and not every app uses tabular data or offers documents in PDF format. If such a requirement could not be assessed, this was noted accordingly in the test protocol.
Calculation and presentation of results
This chapter documents the calculations of the results.
Introduction: Accessibility profile as a important tool
The accessibility profile is an important tool for assessing the accessibility of an app. Grouping the 46 success criteria into twelve thematic categories gives a differentiated picture of the specific strengths and weaknesses of a tested app. The accessibility profile comprises the following twelve thematic categories:
Overview
Parameters measured
The following parameters were measured during the tests:
| Parameter | Source | Purpose |
|---|---|---|
| Degree of compliance | Criteria-based tests | Degree of compliance achieved for each of the 46 WCAG requirements examined (if applicable) |
| Feasibility | Scenario-based tests | Information on the barrier-free feasibility of a scenario |
The following chapters show the calculations of the results obtained for these parameters.
Calculated results
A number of results were calculated on the basis of the parameters measured:
Detailed evaluations of an app
Accessibility profile
Calculation
| Step | Value | Calculation |
|---|---|---|
| 1.1 | Degree of compliance with a requirement | Average value of performance assessments per requirement |
| 1.2 | Degree of compliance with an aspect of the Accessibility Profile | Total sum of requirement averages assigned to the same aspect |
| 1.3 | Normalised degree of compliance of an aspect of the accessibility profile | Normalising the total sumExplanation: Not every aspect of the accessibility profile consists of the same number of requirements. In order to be able to compare the different aspects, the degree of compliance of each aspect needs to be normalised. |
| 1.4 | Degree of compliance of an individual aspect in the accessibility profile | The normalised degree of compliance of a single aspect (step 1.3) is converted to a scale from 1 to 5 and then rounded to the multiple of 0.5.A rounding occurred when the remainder of the division ‘number by multiple’ was greater than or equal to ‘half of multiple’. |
Representation

The maximum five achievable points are displayed on a scale of five circles. An integer value is represented as a full circle; a half value with a half-filled circle. This produced a kind of level gauge for each aspect: the more circles were filled, the more accessibility requirements were met.
The meaning of the values corresponds to the following scale:
| Value range | Meaning |
|---|---|
| 4.5 to 5 points | Good accessibility |
| 4 points | Conditional accessibility |
| 3 to 3.5 points | Insufficient accessibility |
| 0 to 2.5 points | Poor accessibility |
Scoring of feasibility
Calculation
| Step | Value | Calculation |
|---|---|---|
| 2.1 | Scenario score average | Average value of the scores given by the experts |
| 2.2 | Overall score of all scenarios of an app | Calculation of the overall average from the score averages in step 2.1 |
Representation
The feasibility of the usage scenarios of an app is depicted as an overall score. The score ‘6’ is the highest score, the score ‘1’ is the lowest.
Accessibility by restriction type (experimental)
For a clearer understanding of which groups of people can use an app and to what extent, on this occasion we have experimented with depicting accessibility by type of restriction. This comprises the four dimensions ‘motor skills,’ ‘sight,’ ‘hearing’ and ‘cognition’.
To create the categories, we assigned the 46 WCAG requirements we examined to the respective dimensions of the restriction type. For example, the requirement ‘The keyboard focus is sufficiently visible’ has been assigned to both the ‘sight’ and ‘motor skills’ groups, because both use groups rely on a clearly visible focus. This example also illustrates that the ‘sight’ restriction type includes all people with visual restrictions and that it is not just restricted to blind people.
Calculation
The calculation of accessibility by restriction type works the same as for the calculation of values for the individual aspects of the accessibility profile. The only difference is the different grouping of the 46 requirements examined.
| Step | Value | Calculation |
|---|---|---|
| 3.1 | Degree of compliance with a requirement | Average value of performance assessments per requirement |
| 3.2 | Degree of compliance of a restriction type | Total sum of requirement averages assigned to the same restriction type |
| 3.3 | Normalised degree of compliance of a restriction type | Normalising the total sumExplanation: Not every aspect of the accessibility profile consists of the same number of requirements. In order to be able to compare the different aspects, the degree of compliance of each aspect needs to be normalised. |
Representation


A radar chart is used to represent accessibility by restriction type. It is circular in shape and has axes that are like the spokes of a wheel. A scale of 0 to 100 per cent has been selected. This value represents the degree of compliance with accessibility requirements. Each aspect is assigned to a quarter circle and the values are mapped from the centre of the circle to the periphery. The lowest value is in the centre, while the highest value is in the outermost circle. When the four value points are connected, the result is a square area that is typical of each app and makes the coverage of the restriction types visually tangible: The larger the rectangular area, the more comprehensive the fulfilment of accessibility requirements for all types of restriction. The more regular the square is, i.e. it resembles a square, the more balance there is with regard to the groups of people taken into account.
A note on the scores in the ‘Hearing’ dimension: Most of the relevant criteria in the ‘Hearing’ area relate to multimedia content. However, most of the apps we looked at do not contain such content. For this reason, only the requirement ‘Content is not only conveyed through sensory properties’ was applicable to the majority of the apps in the ‘Hearing’ section. In success criterion 1.3.3 of WCAG 2.1, sound is explicitly included as a sensory feature. One example of this might be where an app’s notifications or feedback are purely acoustic. The implementation of this criterion has mostly been met, with most apps achieving 100 per cent compliance.
Overall assessment of the accessibility of an app
The overall rating of an app is calculated based on the following two indicators:
Methodological considerations
In practice, the violation of a single WCAG requirement may mean that the entire app or parts of it are no longer usable (for example, if an alternative input method such as a keyboard or controller cannot be used, or if a smartphone is fixed in a holder in landscape format but the app cannot run in landscape format). However, the aggregation of individual criteria into an overall value renders such serious individual infringements invisible in the overall result. This means apps can achieve a solid overall value despite occasional serious accessibility violations, even though, in reality, they are barely usable for some groups of people. A purely criteria-based assessment might therefore suggest accessibility which does not exist in practice. In order to counteract such distortions, we have included a scenario-based assessment as a corrective part of the overall assessment.
Calculation
The calculations were performed on a normalised scale of 0 to 1. The table below shows the steps involved in calculating the overall rating.
| Step | Value | Calculation |
|---|---|---|
| 4 | Total value of the criteria-based assessment | Average of the normalised degrees of compliance (Step 1.3) for all twelve aspects of the accessibility profile |
| 5 | Total value of the scenario-based assessment | Conversion of the overall score to a scale from 0 to 1, so that the score scale is in the same format as the normalised values of the accessibility profile (see step 1.3). |
| 6 | Overall rating of an app | The total value from the criteria-based assessment (step 4) and the total value from the scenario-based assessment (step 5) are added together at a rate of 50% each. |
In order to ensure that the scenario-based assessment only acted as a corrective measure, the scenario-based assessment score could not exceed the criteria-based assessment score in calculation step 6. I.e. for example, if the percentage for the scenario-based assessment was 0.47 points but the percentage for the criteria-based assessment was lower at 0.41 points, the value for the scenario-based assessment was truncated to 0.41 points. This approach avoids any methodologically undesirable upgrade of the overall judgement due to scenario-based assessment.
Representation

The overall assessment shows the current state of accessibility of an app in a kind of barometer on nine horizontally arranged fields. For the percentage scale from ten to ninety per cent, the calculated value for the overall assessment is directly depicted. The interpretation of the values is the same as for the accessibility profile. The value ranges and meanings are as follows:
| Value range | Meaning |
|---|---|
| 90% and above | Good accessibility |
| 80% and above | Conditional accessibility |
| 60-79% | Insufficient accessibility |
| 0 to 59% | Poor accessibility |
Positioning in the overall field
The positioning of the investigated apps in the overall field allows a classification of where the apps stand in relation to one another in terms of accessibility. No explicit order of precedence was used.
Calculation
| Step | Value | Calculation |
|---|---|---|
| 7 | Degree of compliance in the overall rating | The overall rating of an app (step 6) was converted to a scale from 1 to 5 and then rounded to the multiple of 0.5.A rounding occurred when the remainder of the division ‘number by multiple’ was greater than or equal to ‘half of multiple’. |
Representation
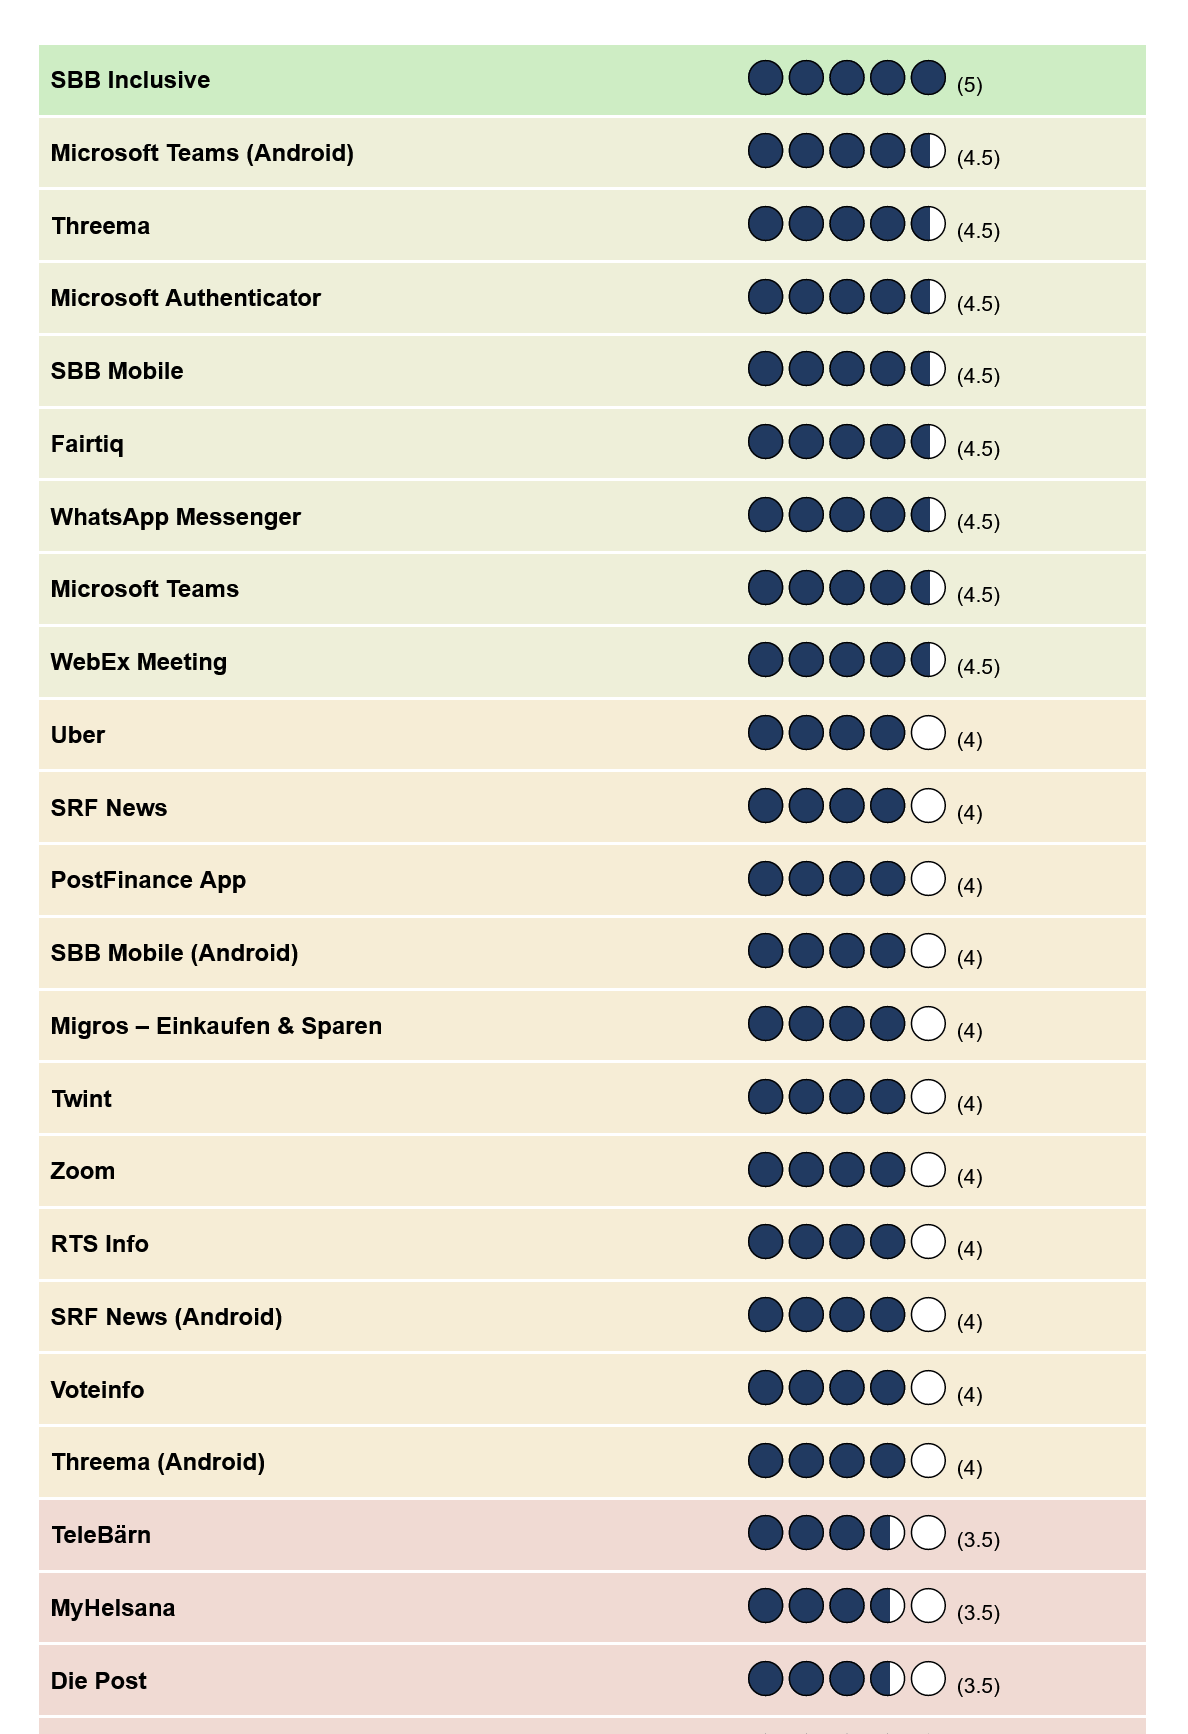
The overall field of the apps is displayed in a table: The top position is taken by the app with the highest overall rating, while the bottom position is taken by the app with the lowest overall rating. The overall rating of each app is shown in the second column using the simplified scale of five circles. An integer value is shown as a filled-in circle; a half-value with a half-filled circle. This produced a kind of level gauge for each aspect: The more circles were filled, the more accessibility requirements this app met.
External validation of results
The results we calculated were evaluated externally as part of an evaluation study. The Institute for Data Analysis and Process Design of the Zurich University of Applied Sciences (ZHAW) reviewed the methods described and replicated the results independently of our own calculations. ZHAW’s parallel calculation obtained the same results as our internal calculation.